


Introduction
After recently completing my player rating metrics, I wanted to integrate them into my prediction model to see if it improved performance. The metric used here is Current Ability (CA), which I designed to estimate a player’s true level right now. Over the All Star break I built the 2.0 version with clear goals: better account for who is actually on the floor, separate dips in form due to injuries from true decline, and distinguish variance from true team ability.
The model uses gradient boosted decision trees trained on multi‑season game data. They are a good fit here because they capture nonlinear interactions without forcing a fixed linear relationship. The inputs include season‑level team strength, recent form, and roster strength built from minutes‑weighted CA. The model predicts margin and total points, then converts margin into a win probability using the historical margin variance from the training set. It is validated on the most recent full season to check generalization.
How the Model Works
1. Team performance
The base team signal comes from season to date performance metrics and an Elo style rating that updates after each game. This captures overall quality and accounts for strength changes over time.
2. Roster quality
CA is aggregated into team level values using minutes weighted projections. The model produces two views of roster strength:
A healthy baseline that reflects expected team CA when the roster is intact.
An availability adjusted version that reflects who is actually expected to play based on injury information.
The model tracks drops in available CA and uses that to decide how much trust to place in recent form. When key players return, it does not just treat that as a short term boost. It also reduces the weight of recent poor form that was driven by those absences. This lets the model recognize when a decline is caused by missing talent rather than a true drop in team quality.
3. Trend and expectation adjustment
The model does not simply look at wins and losses. It evaluates how teams perform relative to expectations based on their roster ratings and opponent strength. That means a team can be treated as improving even while losing, if the underlying performance is strong. For example, if the Wizards drop three straight games but play three strong opponents close, the model treats that as a positive signal. At the same time, it avoids over‑rewarding wins against teams that look strong at the season level but are missing multiple key players. This helps it capture true shifts in team performance without overreacting to misleading outcomes.
Power Rankings
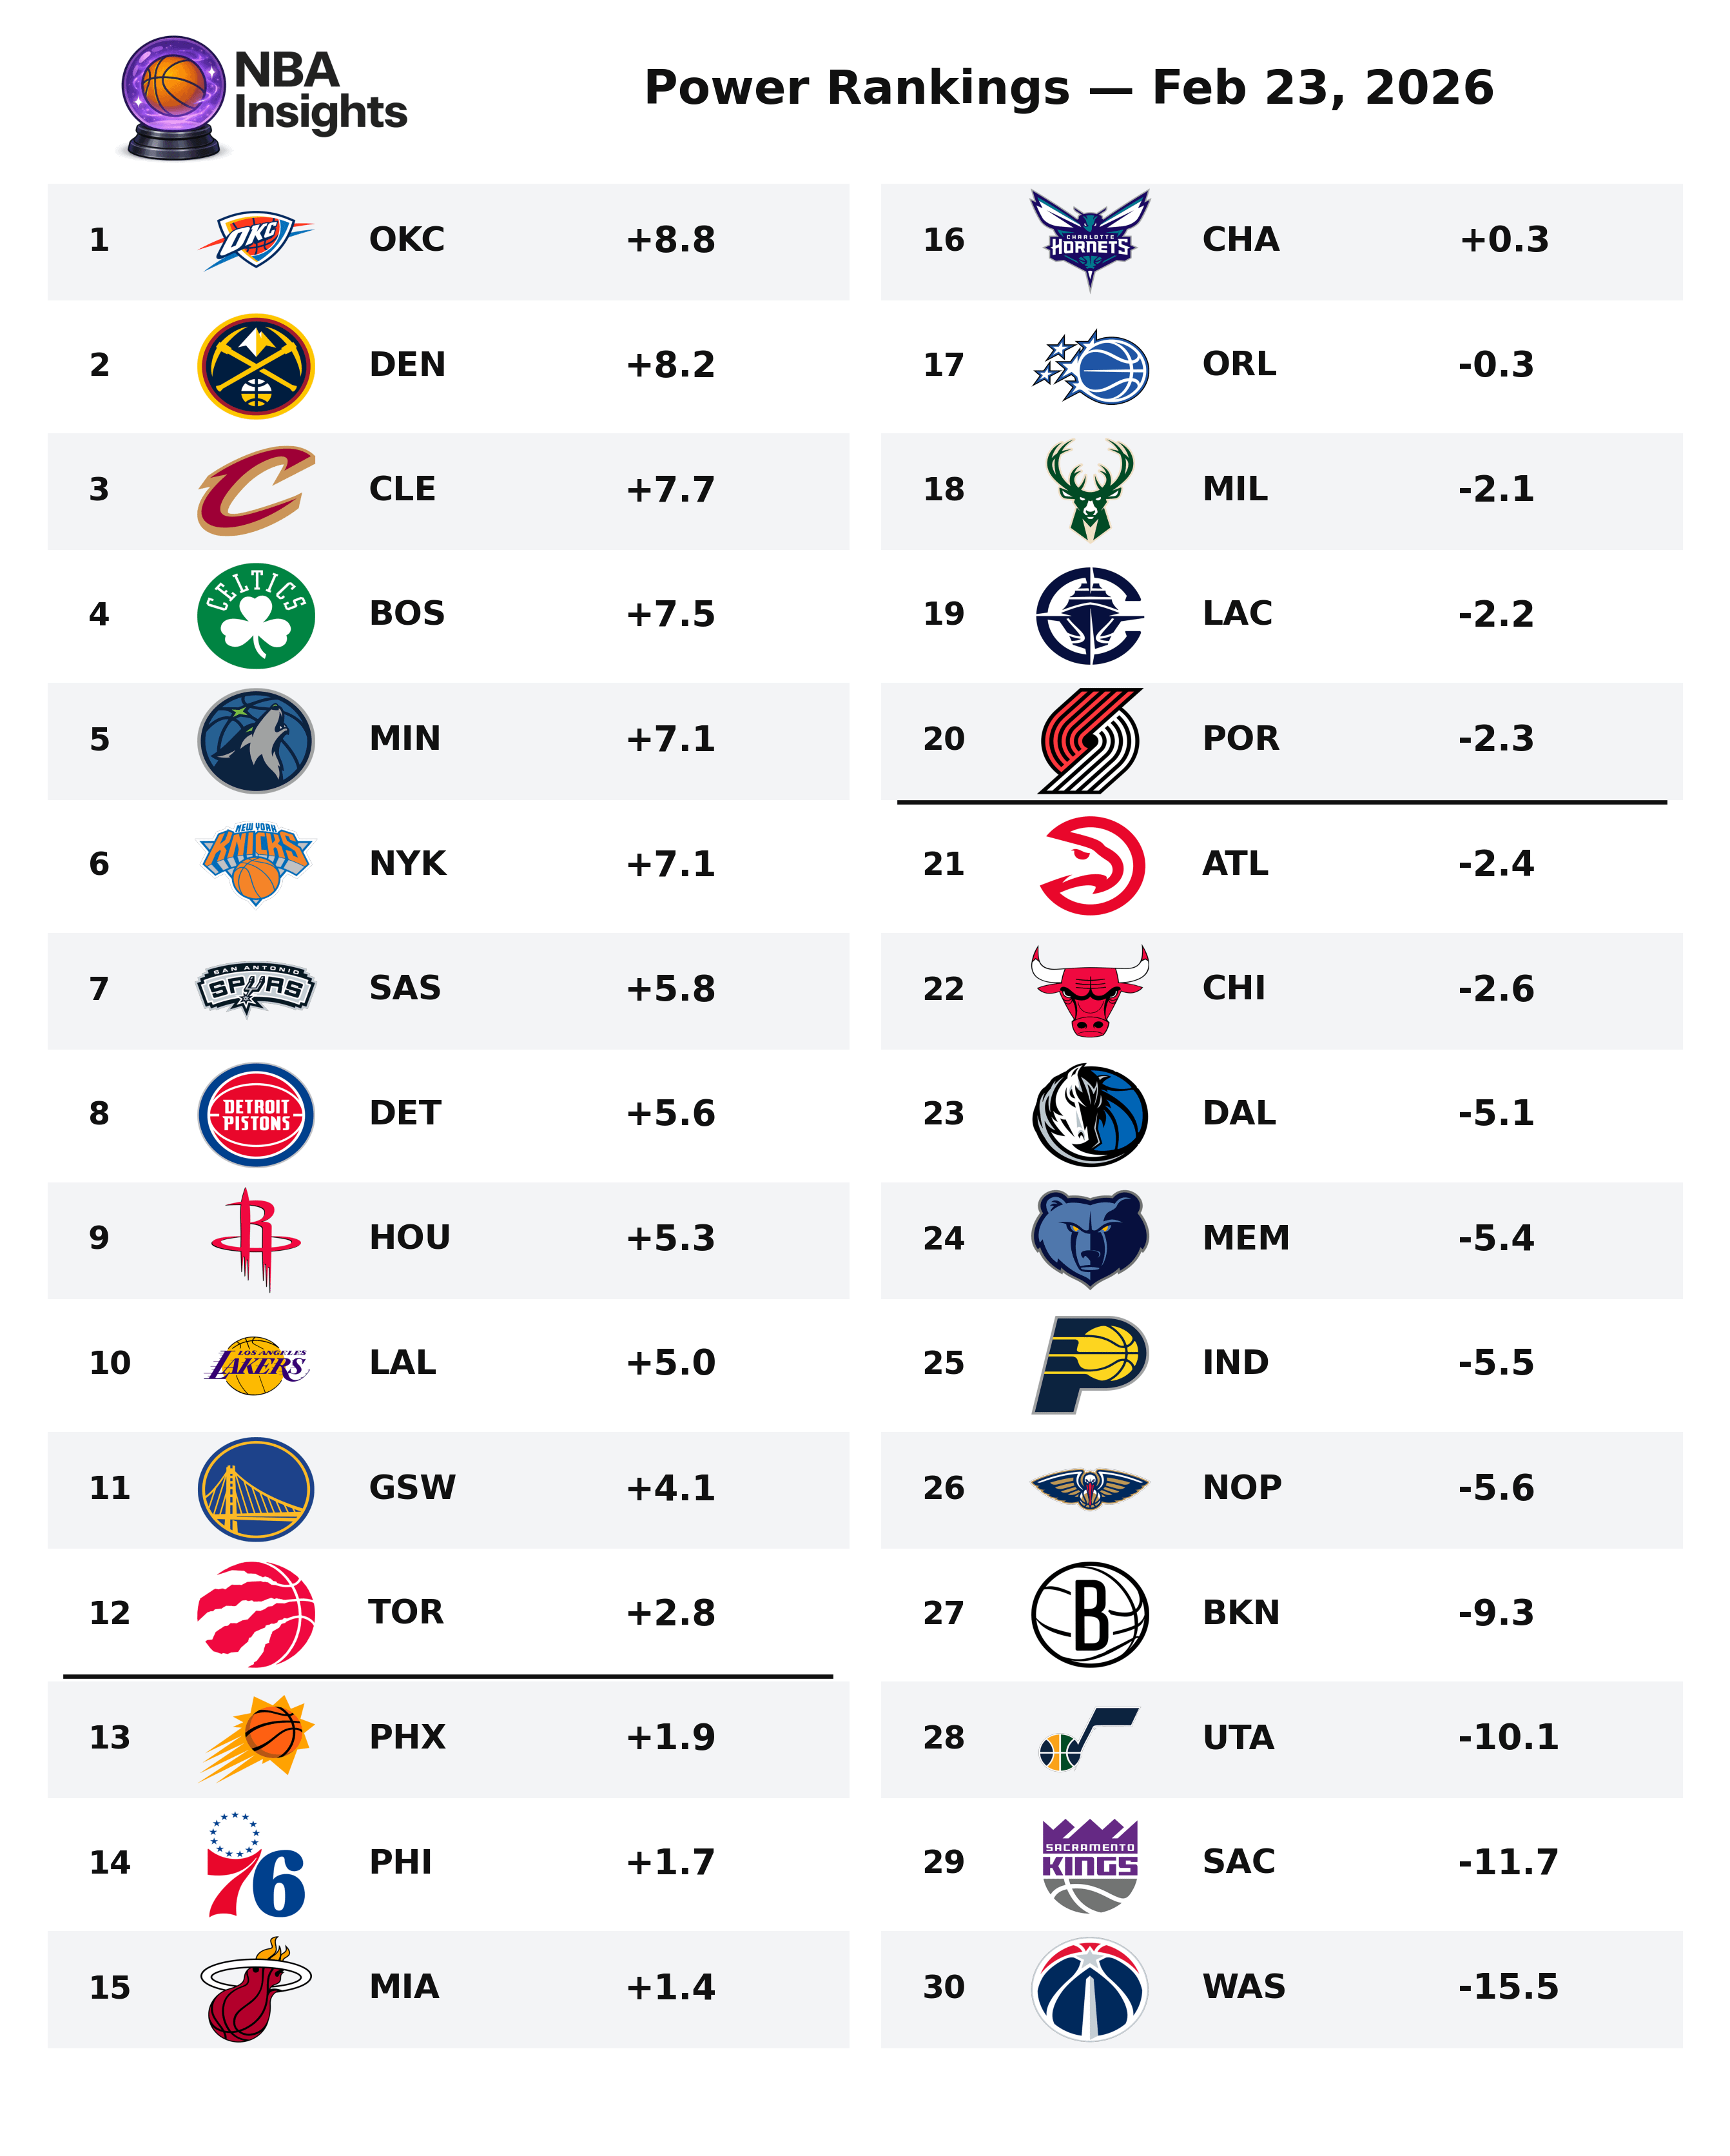
In addition to individual game predictions, the model can also be used to generate power rankings. Short‑term form features are held constant, and only players with season‑ending injuries are excluded. Each team is then simulated against every other team home and away, and the projected margins are averaged. These outputs can be used to rank the league in a way that emphasizes underlying team strength, closer to a title‑odds style view of the league at any point in time.
That’s a nice upgrade. Would be cool to see these rankings weekly.
Top tier upgrades and explanation. Way to go!