

Roster Construction in the NBA — Using Player Ratings, Archetypes, and Lineup Synergy for Roster Evaluation and Trade Analysis

Introduction
This post introduces my roster construction model, built around three projects I’ve been working on:
Player ratings: Season Rating (SR), Current Ability (CA), and Potential Ability (PA), used to evaluate individual players (learn more here).
Player archetypes: labels that classify a player’s role on both offense and defense.
Lineup synergy scores: a way to identify archetype combinations that consistently overperform after adjusting for player ability.
The purpose of the roster construction model is to identify the archetypes that would strengthen a team the most, then search within those archetypes for player targets. How those targets are ranked depends on the phase the team is in. For a team trying to compete now, the model prioritizes CA and estimates how much each player would increase the team’s projected Net Rating. For a rebuilding team, PA matters more, because the priority is identifying who is most likely to develop into an elite player.
Archetypes
To classify players’ on-court roles on both sides of the floor, I built offensive and defensive archetypes using k-means clustering. The approach and archetype labels are inspired by BBall Index and CraftedNBA.
These archetypes are important for the roster construction model because they let the problem be framed as role fit, not just “add the best player available.” Two players with similar ratings can still have very different impact on a specific team, because one might fill a role the roster is missing or bring a skill set that better complements the players already in place.
The maps below visualize the archetype clusters in 2D.
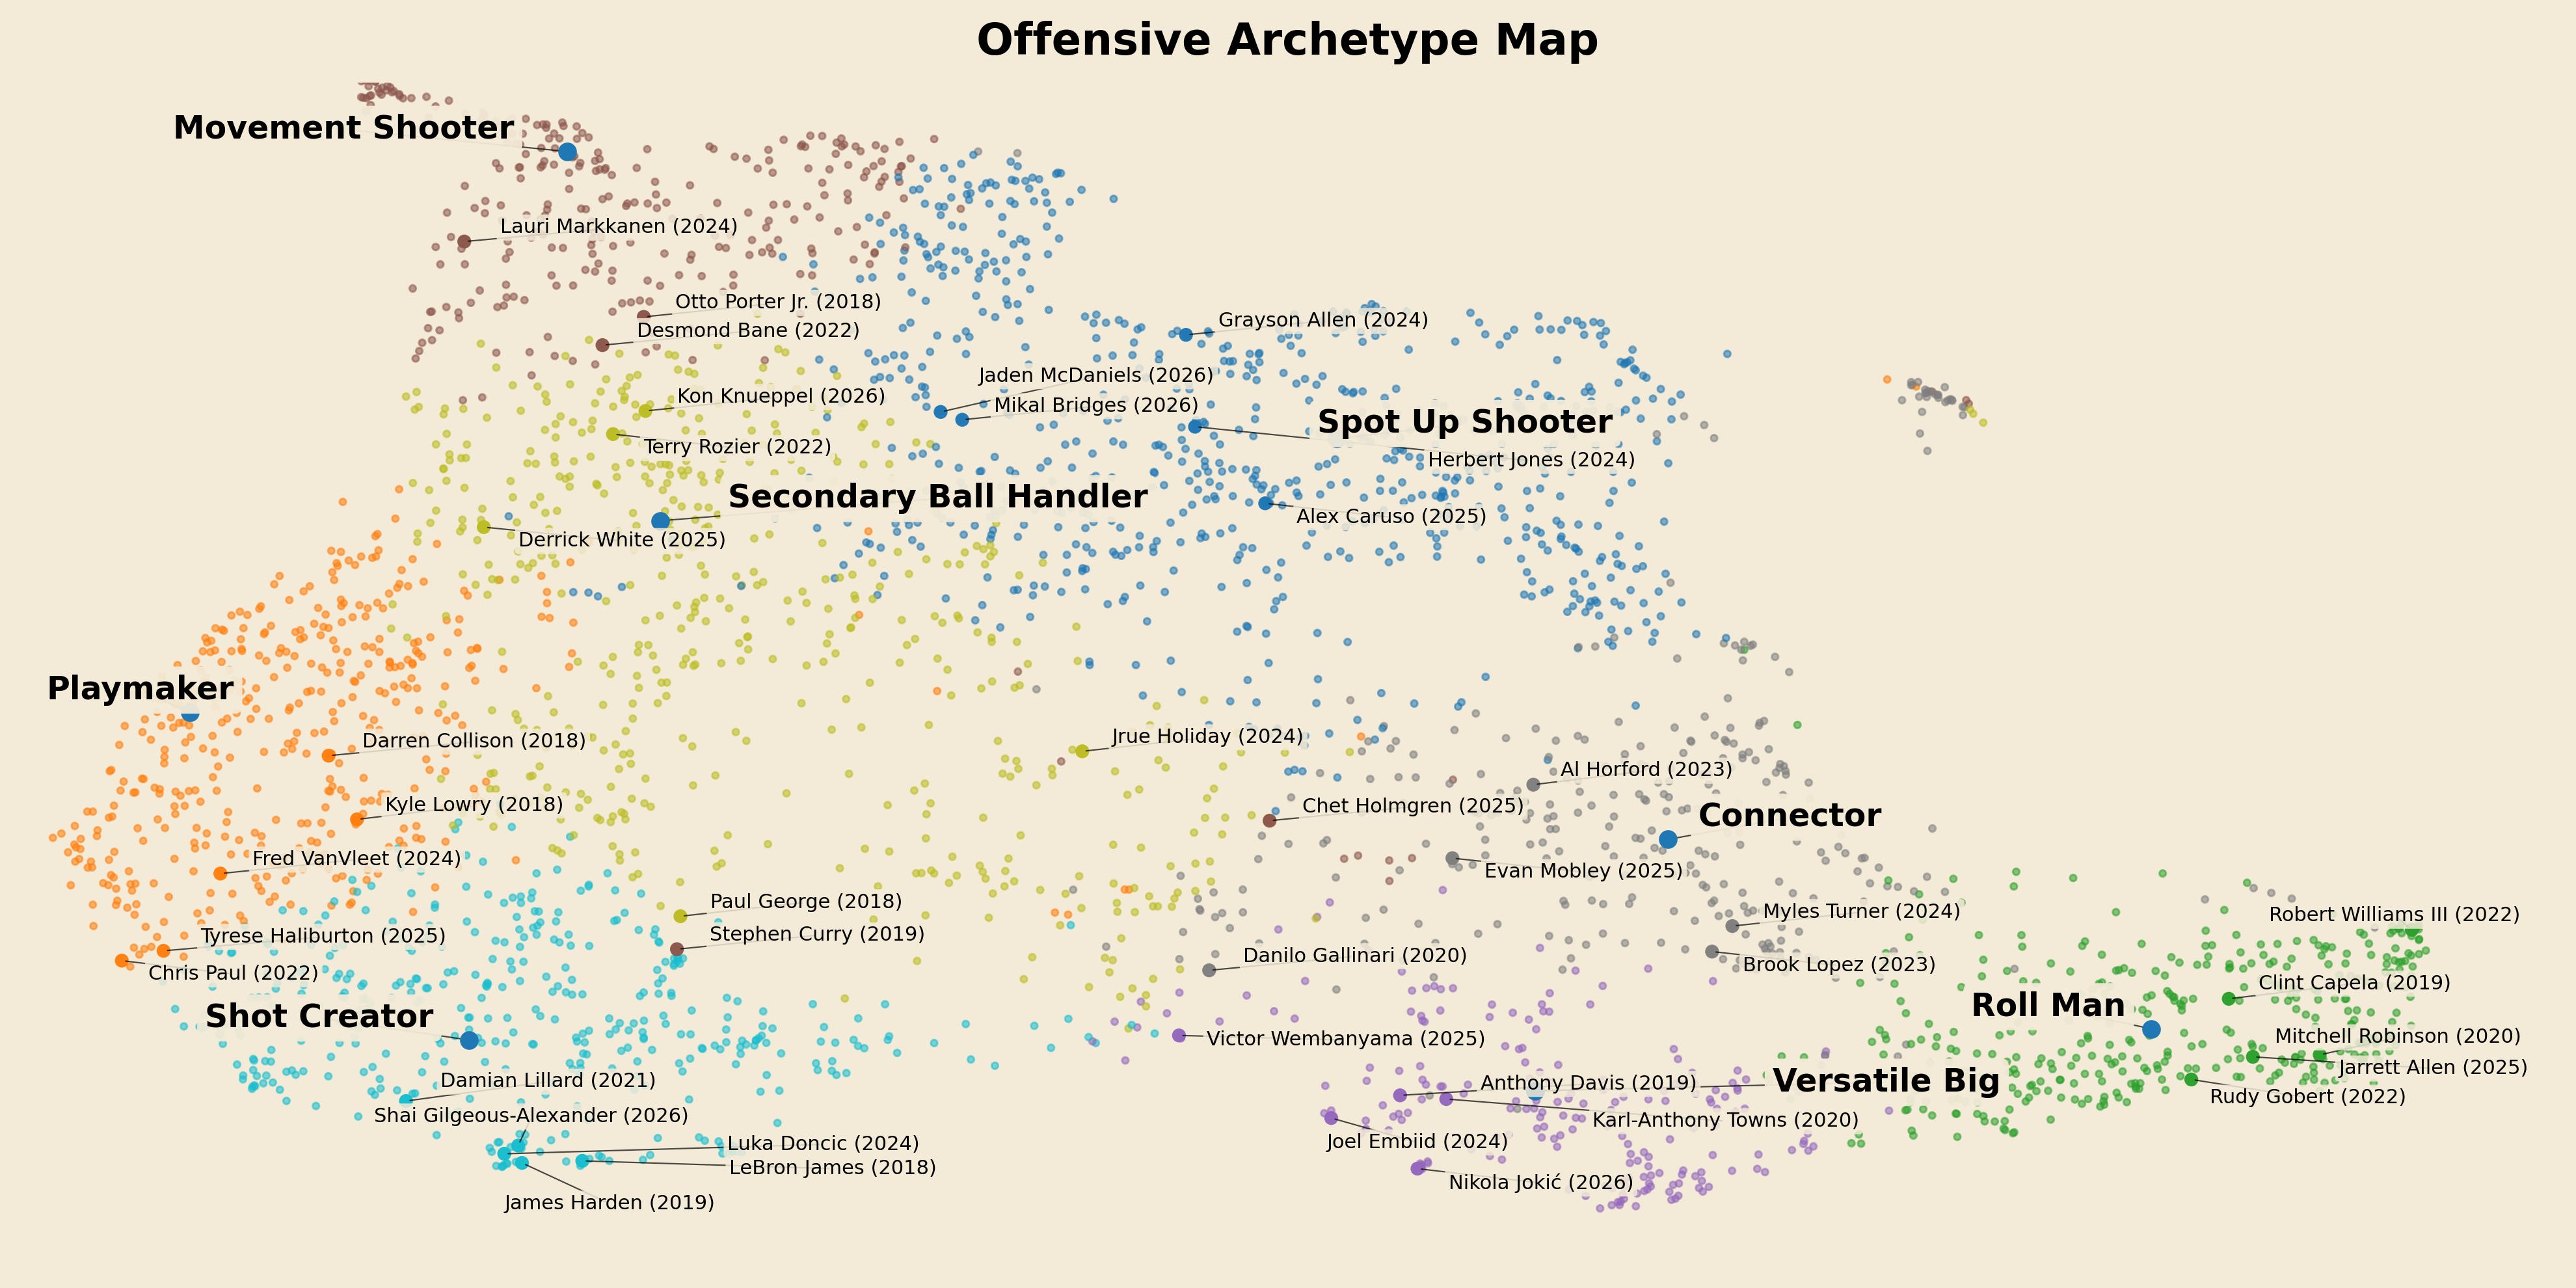
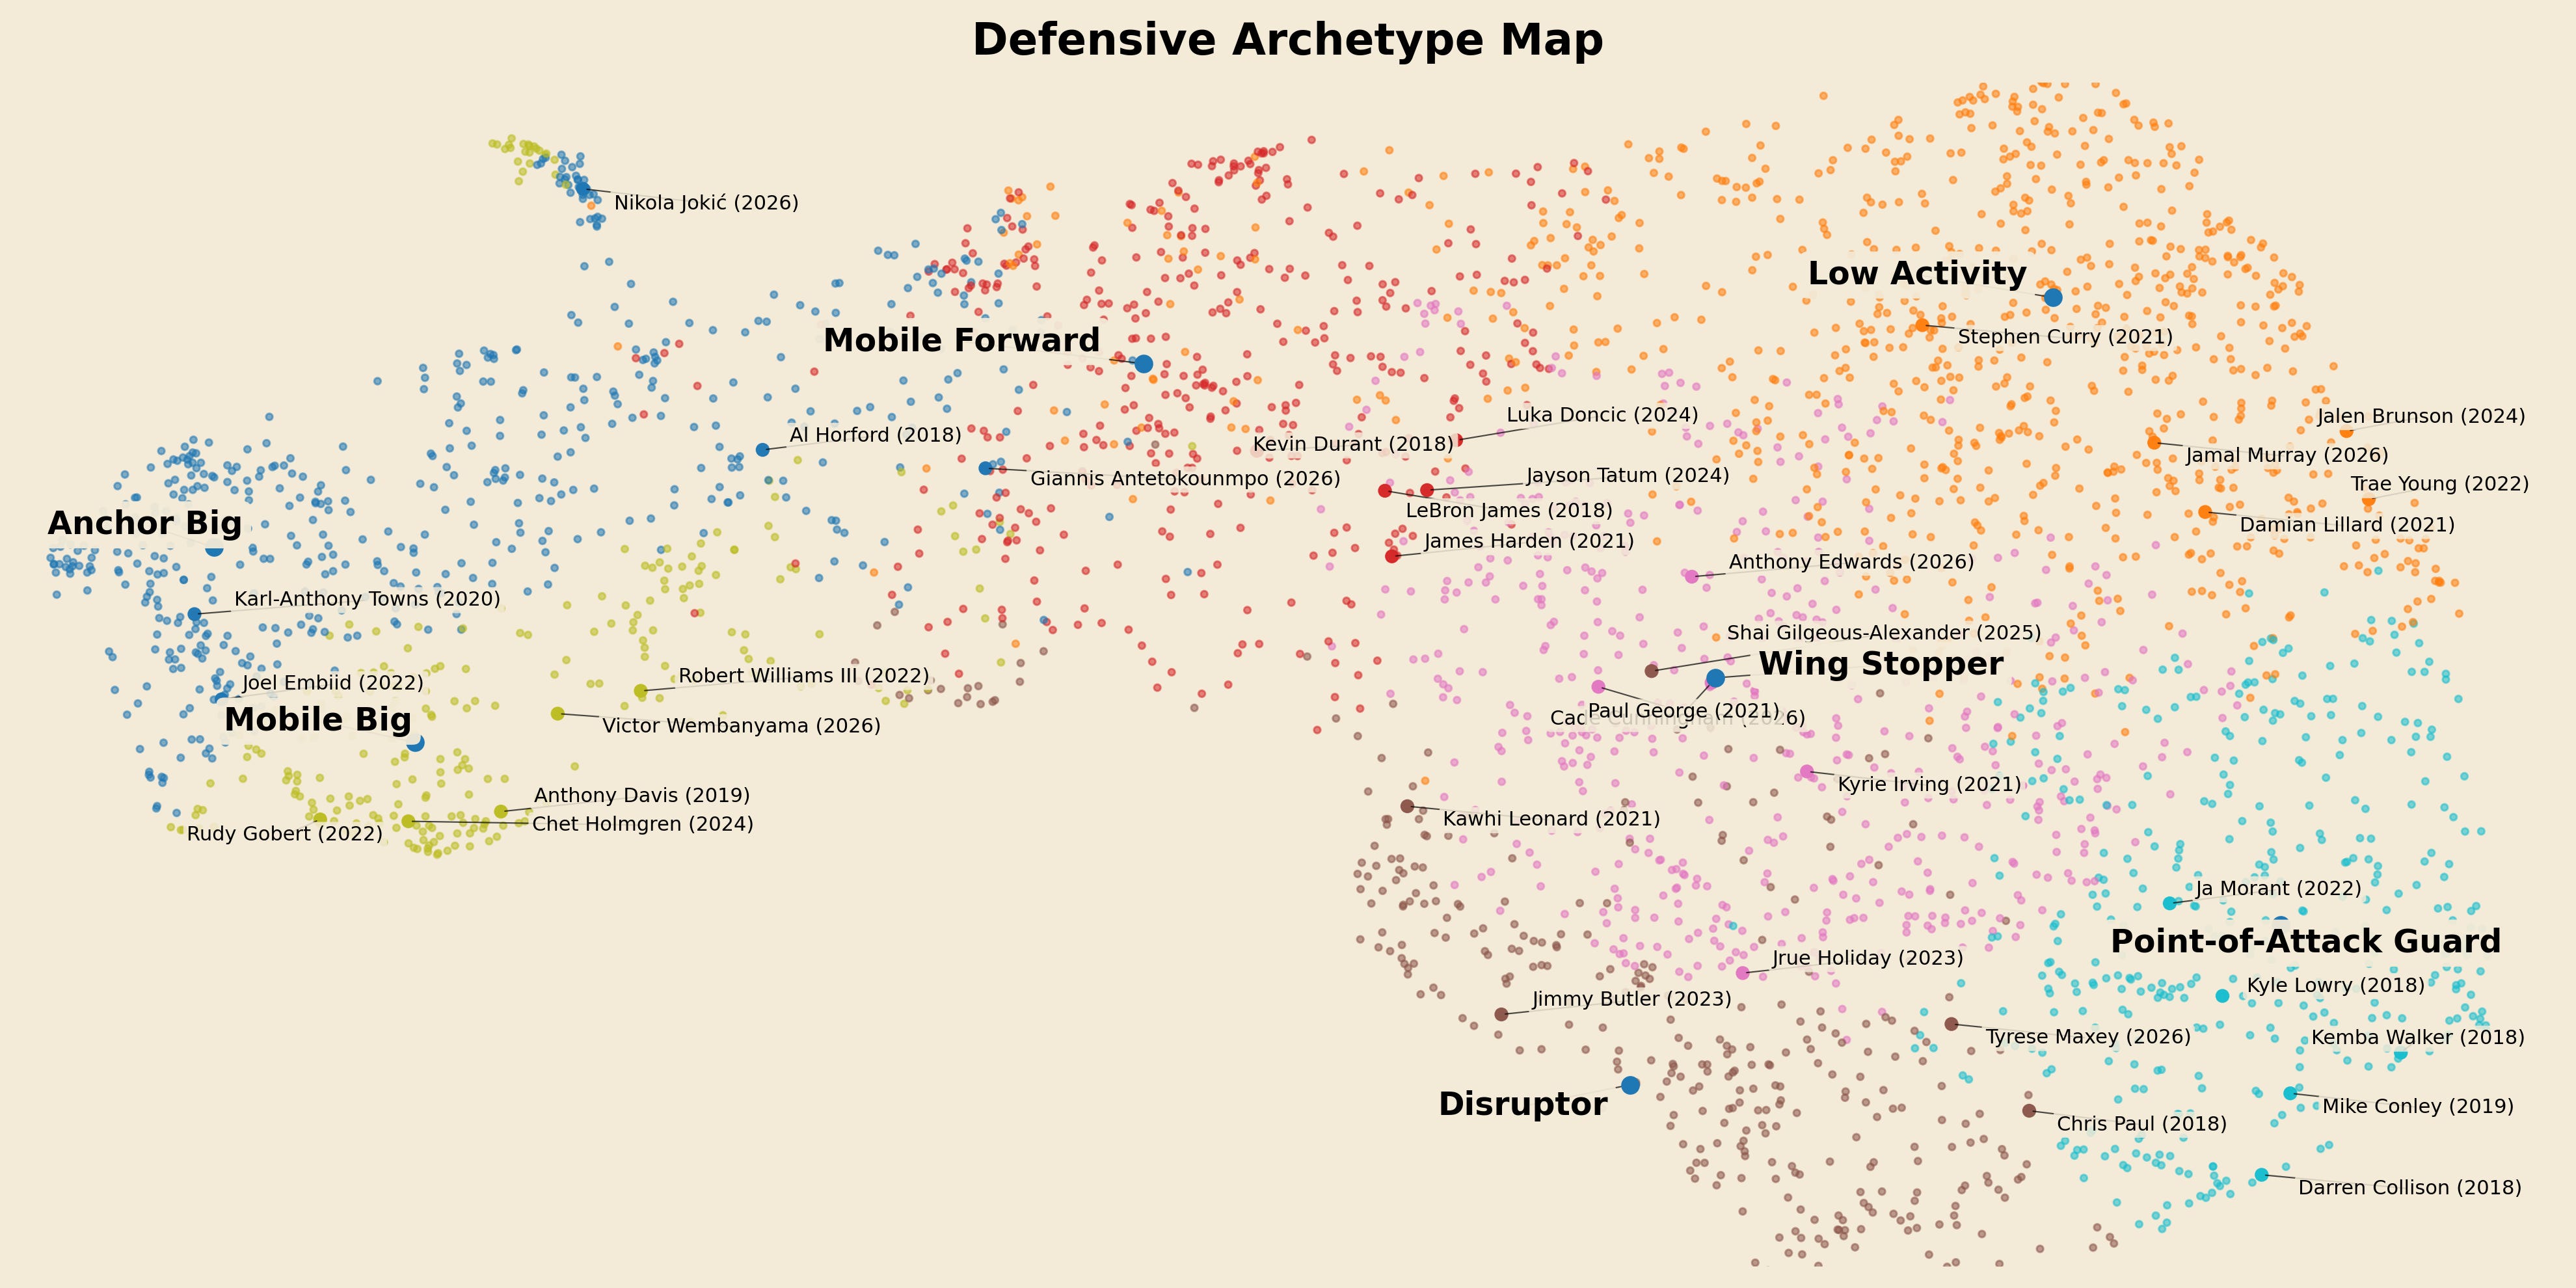
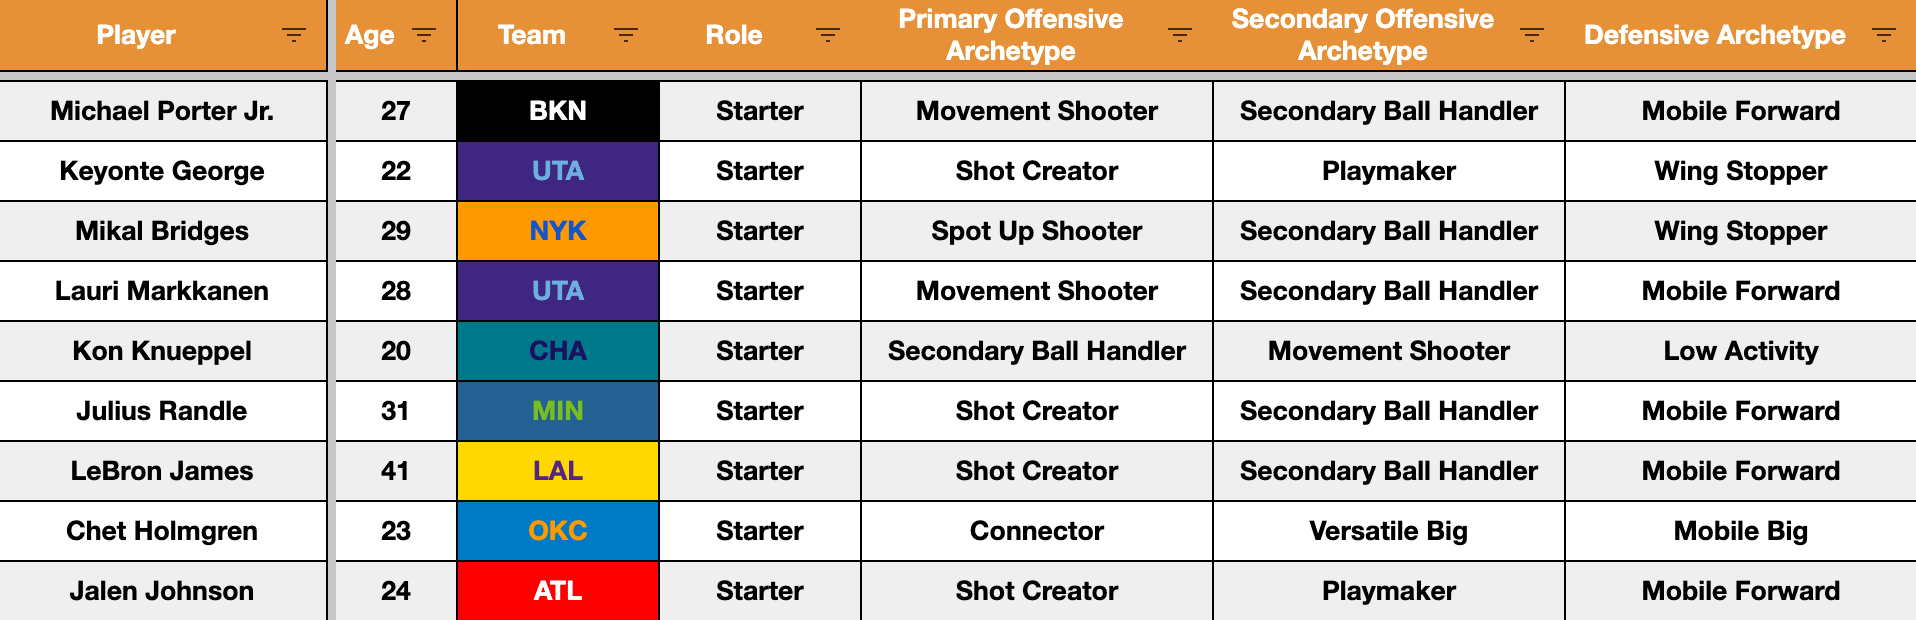
You can view the complete player ratings and archetypes database in the NBA Insights Ratings Database.
Lineup Synergy
By defining lineups through their five-archetype combinations, I developed synergy scores that measure how much a given archetype combination performs better or worse than expected based on the CA of the players on the floor.
Synergy scores are calculated using the same stint-based regression approach used for RAPM, but applied to archetype combinations instead of individual players. In RAPM, lineup overlap is used to quantify individual impact while adjusting for who a player shares the floor with and who they face. The goal here is to figure out how well different archetypes complement each other. However, stint results are still heavily influenced by ability, so if one lineup is clearly stronger than the other, it will usually win that stretch of possessions even if the archetypes don’t fit together particularly well.
With that in mind, the model first luck-adjusts for free throw and three-point shooting variance, then predicts each stint’s net rating using only (i) the CA difference between the two lineups and (ii) a home-court adjustment. The gap between the observed result and the model’s prediction is then grouped by archetype combination and aggregated across thousands of possessions, revealing which combinations consistently overperform relative to the quality of the players on the floor.
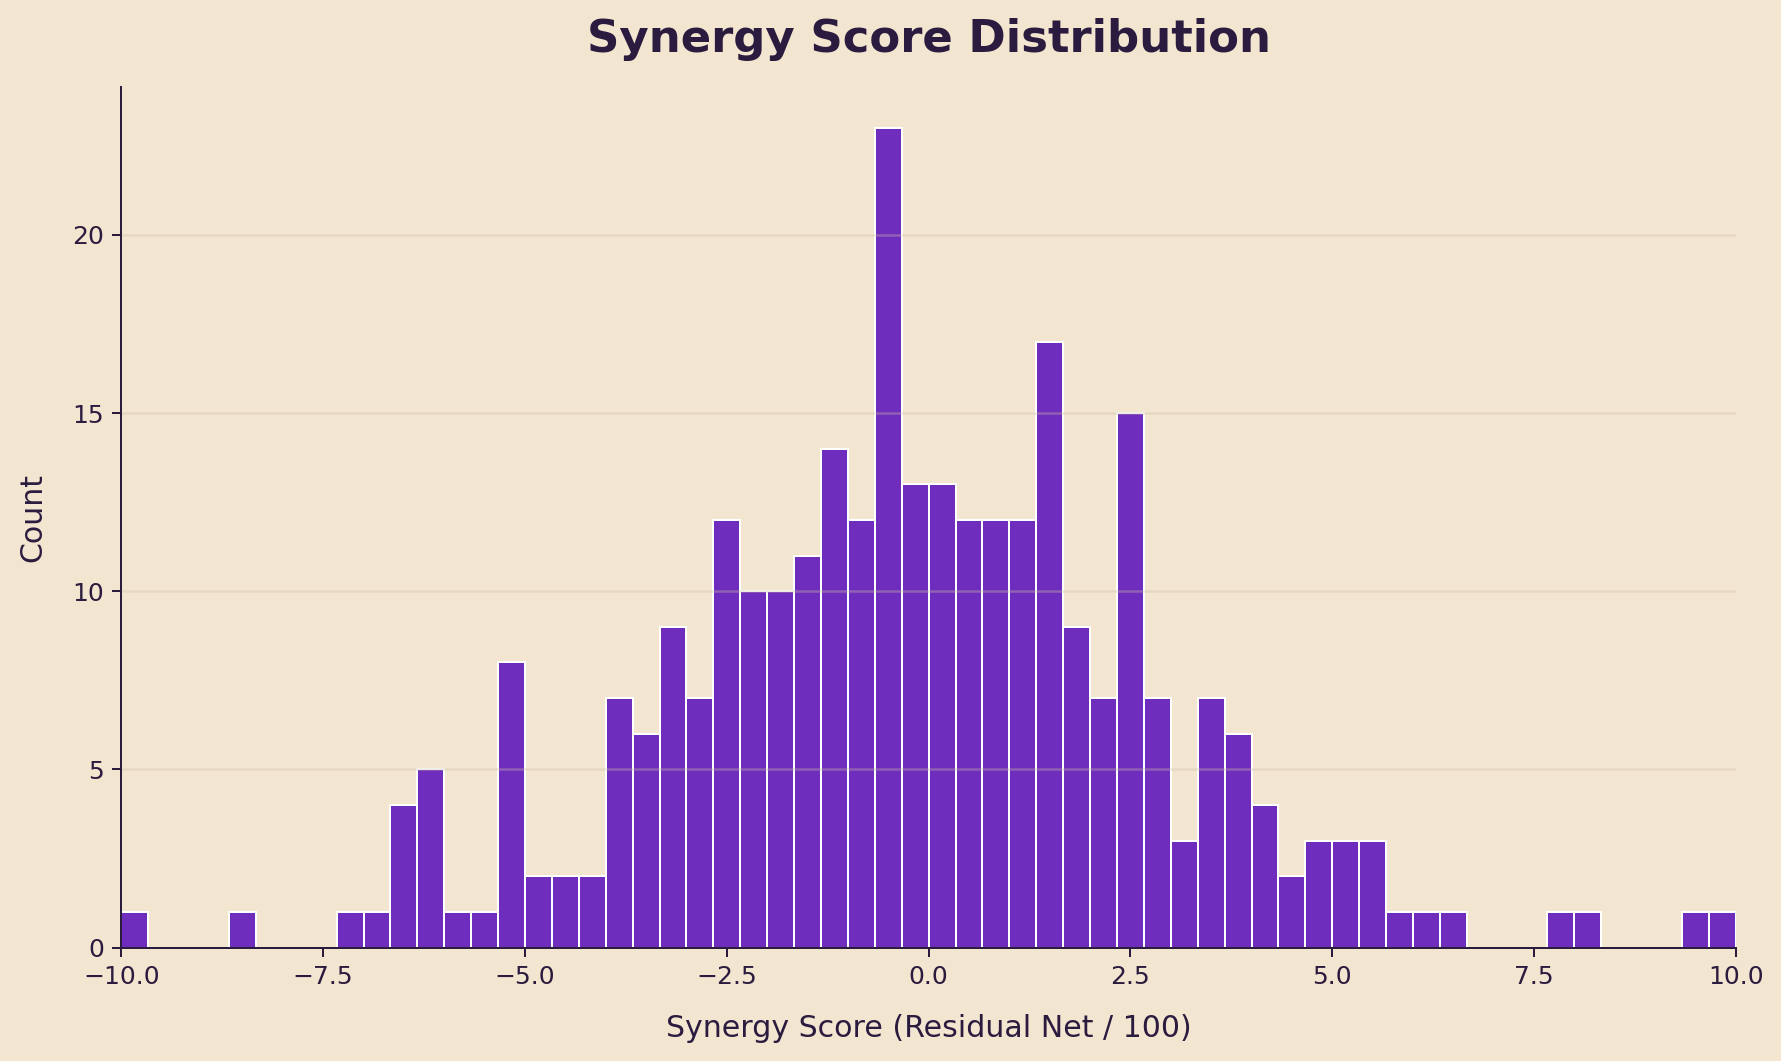
For example, an archetype combination consisting of 2 Spot Up Shooters, 1 Playmaker, 1 Roll Man, and 1 Shot Creator recorded a synergy score of +4.8 over 13,345 possessions from 2018 to 2026, meaning it has, on average, performed 4.8 points per 100 possessions better than what the baseline model expected. To put these scores in context, the chart below shows the distribution of lineup synergy scores for combinations that meet the minimum possessions threshold.
Below are a few of the highest- and lowest-scoring archetype combinations by lineup synergy:
Highest
2 Spot Up Shooters, 1 Playmaker, 1 Roll Man, 1 Versatile Big: +9.9
1 Playmaker, 2 Roll Men, 1 Movement Shooter, 1 Shot Creator: +9.4
1 Playmaker, 1 Movement Shooter, 2 Shot Creators, 1 Connector (Big): +8.0
What these lineups have in common is balance. They combine playmaking, shooting, and players who can create their own scoring opportunities, while still keeping enough size on the floor to hold up physically, finish possessions with rebounding, protect the rim, and avoid getting punished in the paint.
Lowest
2 Spot Up Shooters, 1 Playmaker, 1 Shot Creator, 1 Connector (Small): -9.8
1 Spot Up Shooter, 1 Movement Shooter, 1 Secondary Ball Handler, 1 Shot Creator, 1 Connector (Small): -8.3
1 Roll Man, 2 Movement Shooters, 1 Shot Creator, 1 Connector (Big): -7.1
Small-ball shows up disproportionately in the worst results, which you can see in the first two examples above. Five of the bottom ten lineups are small-ball groups, compared to zero of the top ten. That is consistent with the idea that small lineups no longer create the same spacing advantage they once did. As more bigs can shoot, you can keep the floor spaced without giving up size.
Notice that 1 Playmaker, 2 Roll Men, 1 Movement Shooter, 1 Shot Creator (+9.4) and 1 Roll Man, 2 Movement Shooters, 1 Shot Creator, 1 Connector (Big) (-7.1) are structurally very similar. The key difference is the presence of a playmaker in the top version. Movement shooters create open looks by navigating screens, and without a playmaker to consistently capitalize on those openings, that extra movement shooting can be harder to convert into real advantage.
These results suggest that there is real value in being able to consistently play rotations that produce strong archetype combinations. A team might not be able to run one specific five-man group every night, but a well-built roster can repeatedly put lineups on the floor that fit together at the archetype level, even when players are missing. That idea is what the roster construction model is built to optimize.
Roster Construction
I designed the roster construction model to analyze a team’s roster composition and identify additions that unlock the strongest archetype combinations, whether working with the current roster or exploring hypothetical trade scenarios. The model begins by mapping the distribution of offensive archetypes of a given roster, then searches for which archetype, or combination of archetypes, would produce the largest total synergy score (the sum across eligible combinations) when inserted into specific roster slots.
By optimizing for total synergy score, the model rewards additions that expand the set of archetype combinations with strong synergy scores that a team can access across its rotation. The highest-rated moves are the ones that unlock more consistently positive combinations, increasing the number of viable five-man groups that fit together at the archetype level over the course of a season.
The model has two core components: an archetype search and a trade evaluator. The archetype search is an open-ended exploration of roster needs, identifying the archetype additions that maximize total synergy score across lineup combinations that clear both the minimum possessions requirement and the synergy score threshold. The model then returns the archetypes and combinations that best increase team synergy, along with player targets within the recommended archetypes. The trade evaluator is designed for testing hypothetical trade scenarios. After identifying a shortlist of targets through the archetype search, specific additions and removals can be tested to estimate the net change in total synergy score, projected Net Rating, and expected wins.
What this looks like in practice
Using the Minnesota Timberwolves as an example, the model projects a team Net Rating of +4.4 and an expected win total of 51 games. It arrives at that projection by aggregating the roster’s CA based on the share of possessions each player is expected to play, then mapping roster CA to historical team Net Rating and Net Rating to expected wins. That baseline lines up closely with Minnesota’s performance to date, with a current Net Rating of +4.5.
The archetype search identified a Playmaker as the best fit by total synergy score, which aligns with Minnesota’s need for additional ball-handling and creation. Using the trade evaluator, I then tested a hypothetical scenario where Minnesota trades Rob Dillingham and Terrence Shannon Jr., plus additional assets, for Tre Jones. The model projects that this swap would increase the team’s Net Rating from +4.4 to +5.3, raising expected wins from 51 to 53 over a full season. Jones also fits the team’s timeline. He is only two years older than Anthony Edwards, and his PA, shown in the table below, suggests he still has room to develop.


This trade example is just one way to use the model. It can support teams at different stages, from identifying archetypes to target while building around a young core to evaluating specific win-now trades.
Do you think the NBA front offices will ever adopt an analytical mindset like this to determine players values? It feels very baseball-esque.
One of the coolest models I have ever seen.