


It’s no secret that in the NBA, teams need to invest heavily in player salaries to build and retain a championship quality roster. In fact, 14 of the last 19 NBA champions paid the luxury tax, despite only about one-quarter of the league typically being taxpayers in a given season. Last year’s Finals between the Thunder and Pacers marked the first time neither team was a taxpayer.
")
Still, this isn’t the Premier League. Teams can’t simply spend their way to a title. Instead, success depends on how well teams maximize the value of their payroll. Having recently created Current Ability (CA), a player rating metric, I figured why not use it to evaluate contract value. The idea is simple: compare a player’s current on‑court value to what their Average Annual Value (AAV) implies they should be worth.
Of course, many other factors go into contract evaluation. For example, this analysis does not account for teams paying a premium for a player’s potential. But for teams trying to win now, maximizing the value of each contract is what matters most.
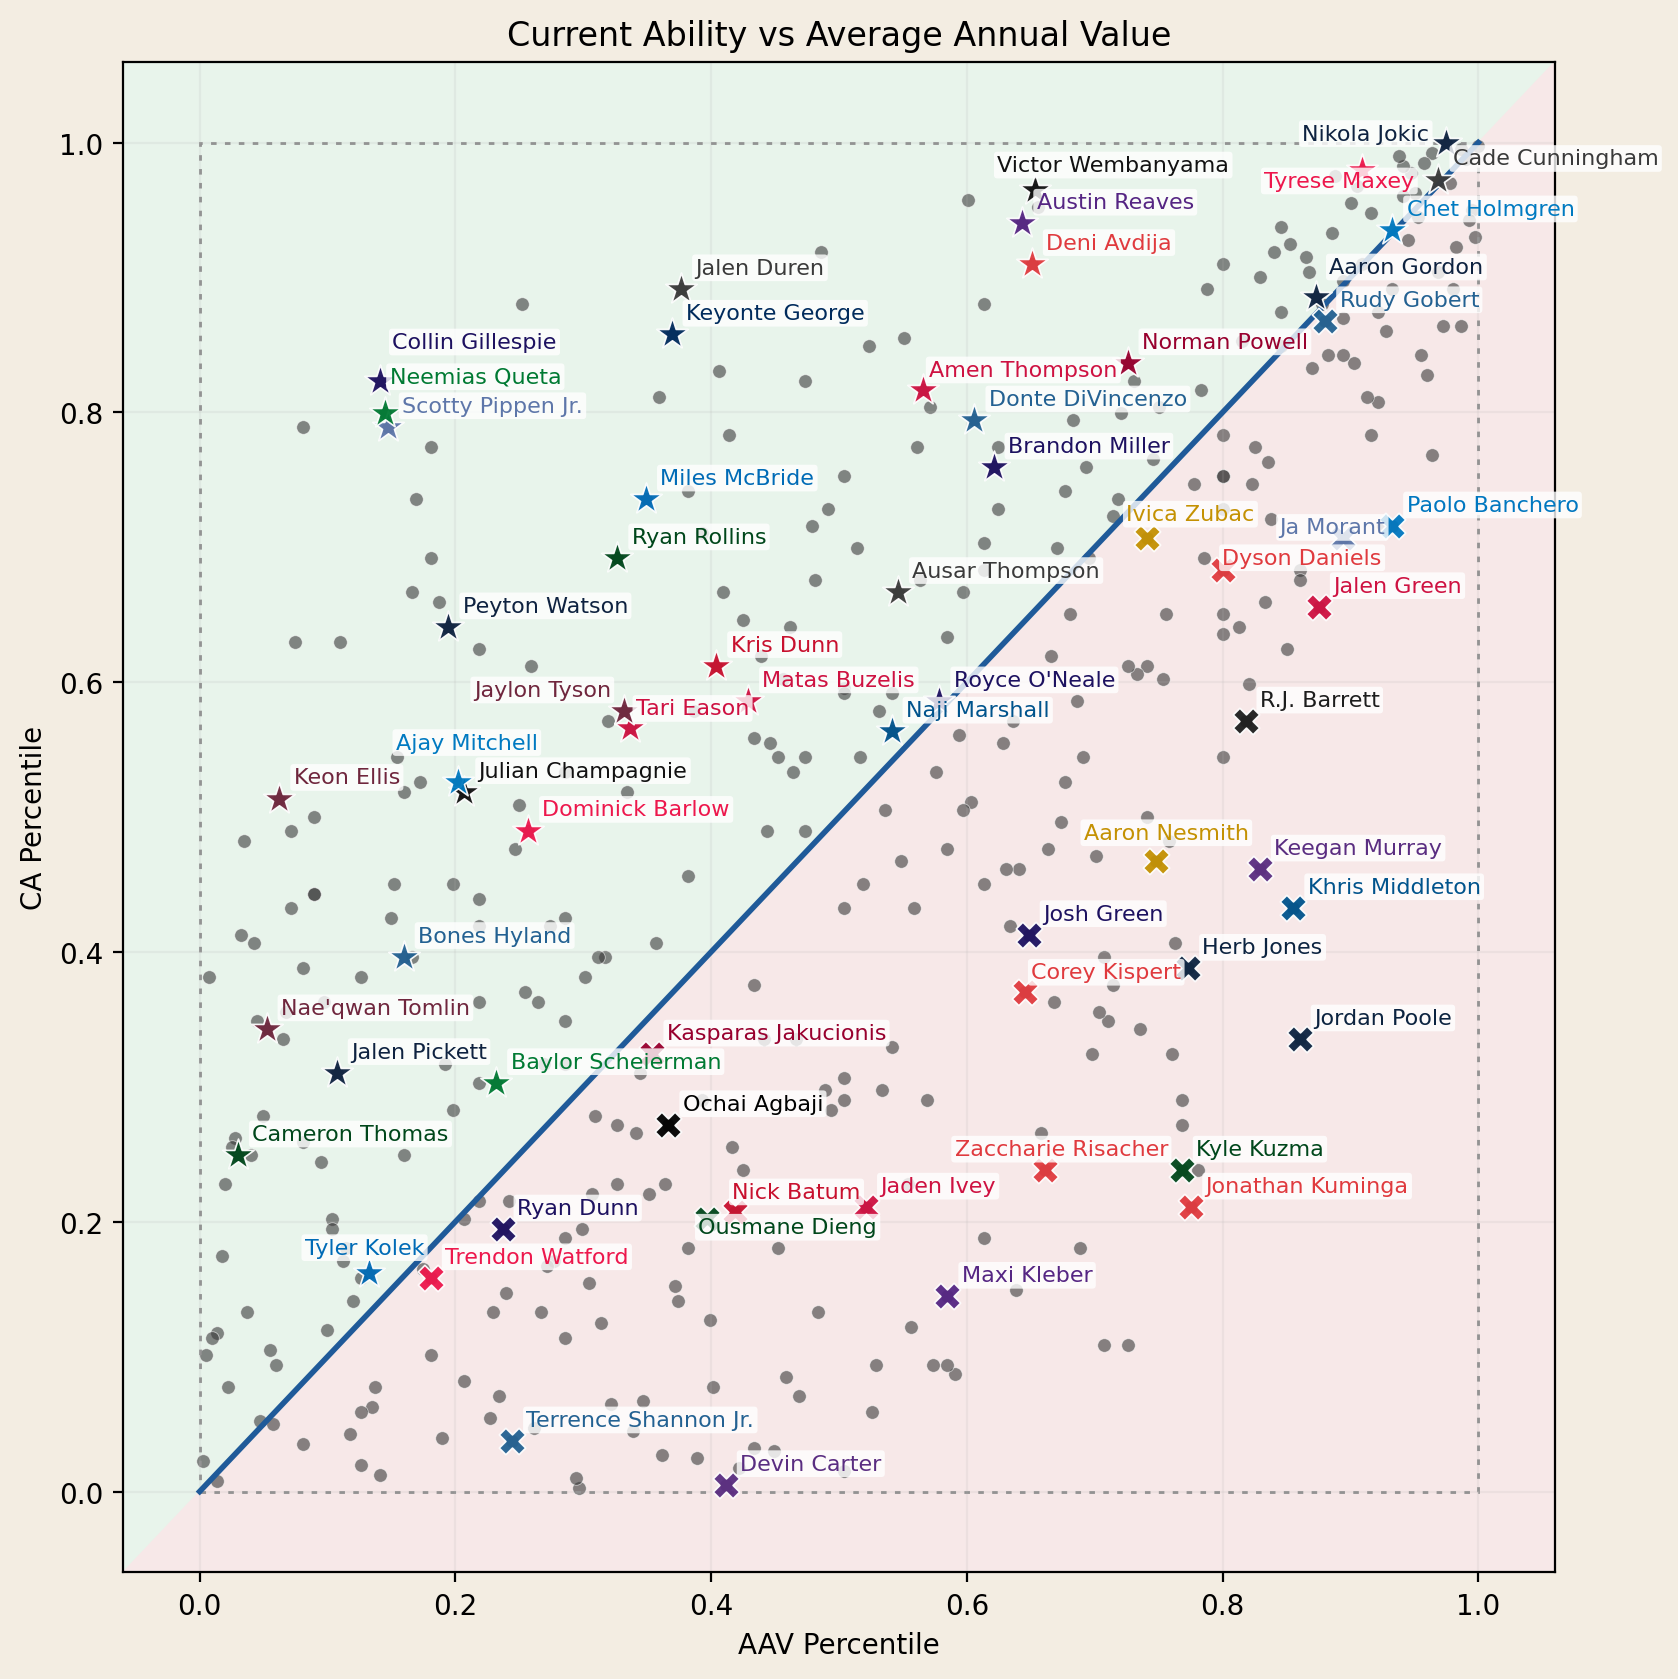
Percentile Map
Displays each player’s CA percentile vs. AAV percentile.
Above the diagonal = performing better than salary rank
Below the diagonal = performing worse than salary rank
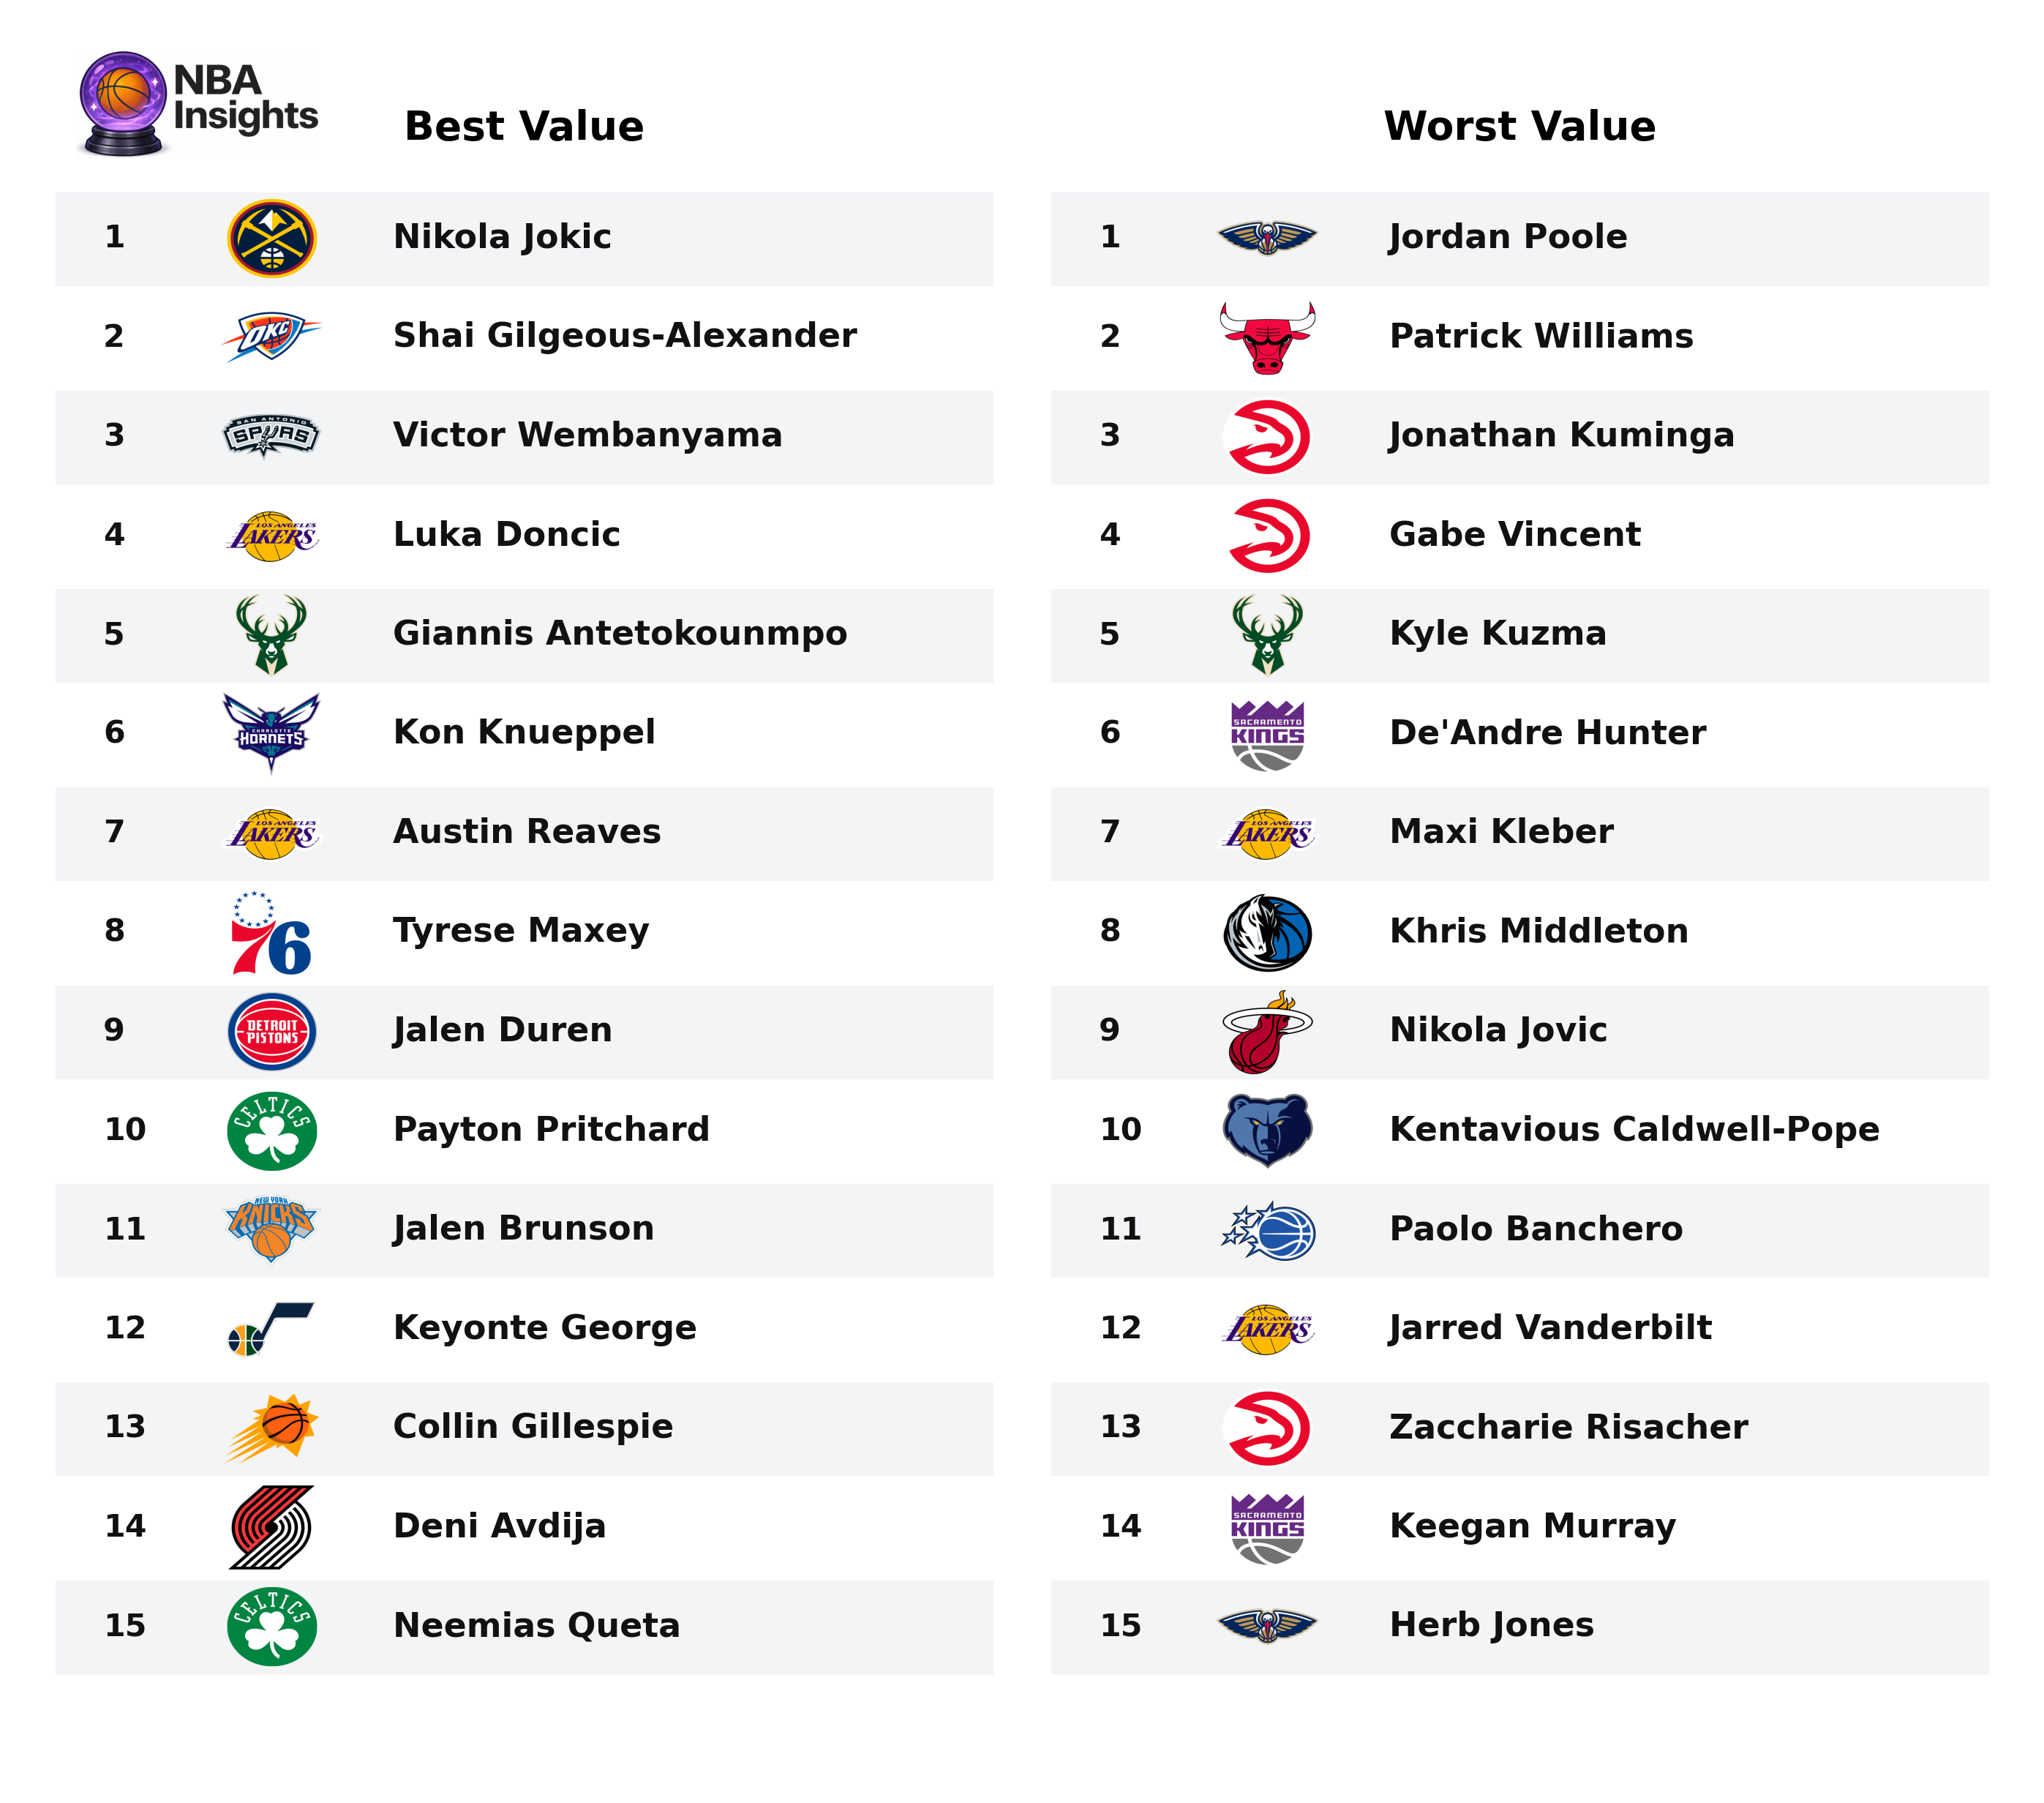
Best and Worst Contract Values
The Current Ability level implied by each salary tier is first estimated using a fitted AAV-to-CA curve. Each player’s CA is then compared to this expectation, and the table highlights the 15 largest positive and negative gaps.
Ultimately, maximizing payroll value is a key factor separating contenders from champions. Organizations that consistently compete at the highest level allocate their cap resources efficiently. While this framework is not intended to fully capture contract value in all contexts, it provides a useful tool for evaluating potential trade targets.